Getting Started
ESPlotter is a Windows application for reviewing power-system simulation results. You open result files, compare channels in interactive charts, organize pages around a study question, and export charts, data, or a complete report. Python automation is optional.
This page takes you from installation to a first exported chart in about five minutes.
1. Install ESPlotter
- Download ESPlotter for Windows.
- Run the installer.
- Open ESPlotter. The first workspace shows
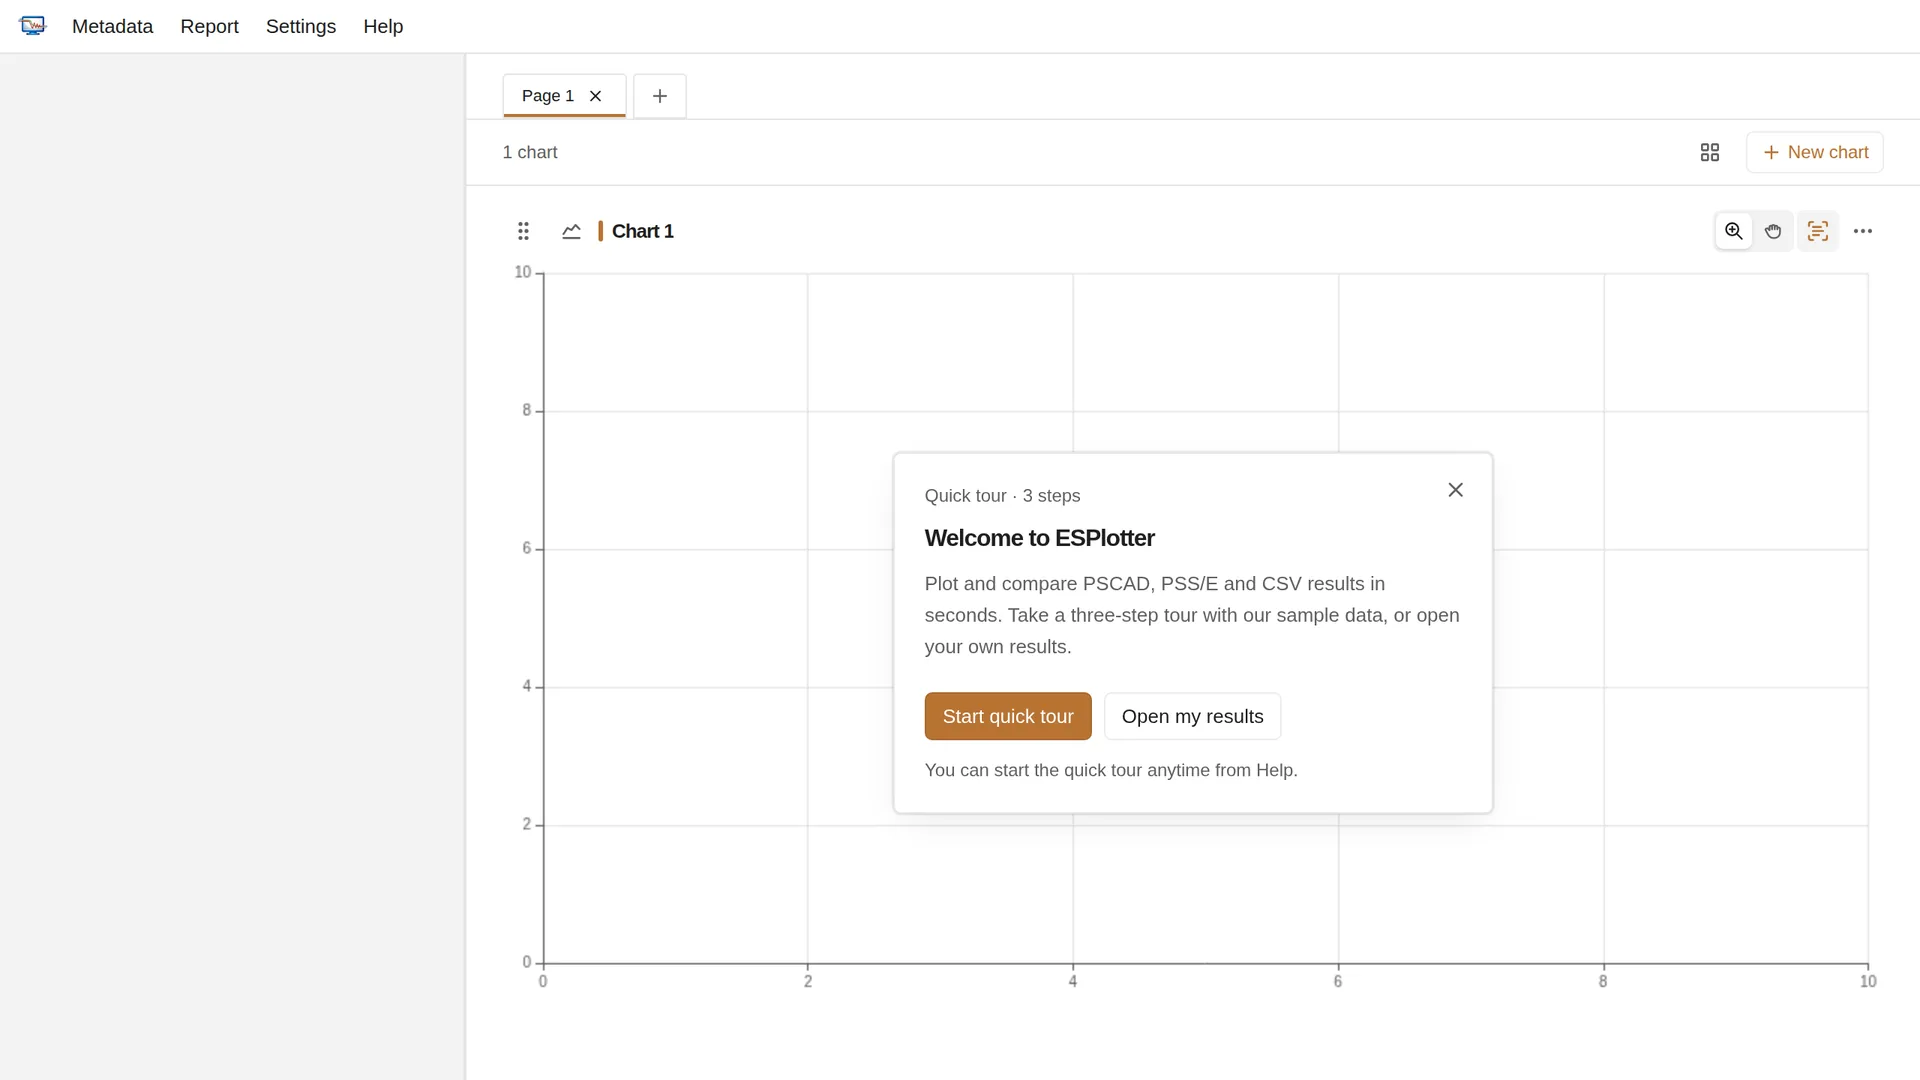
Page 1with one empty chart. On a new local profile, a welcome invitation also offers a quick tour.
Optional: take the quick tour
Choose Start quick tour to try ESPlotter on built-in sample data, or Open my results to open your own files straight away. You can start the tour later from Help > Tours; it keeps your open files and charts.
The tour opens two recordings of the same plant riding through a grid fault three seconds in: a simulation and a site test. You plot Active Power (MW) from both on one chart, then drag across the fault to zoom in and find where they separate. The site test recovers more slowly than the simulation, which is the kind of mismatch model validation looks for. The sample works offline, without downloading a file or installing simulation software.
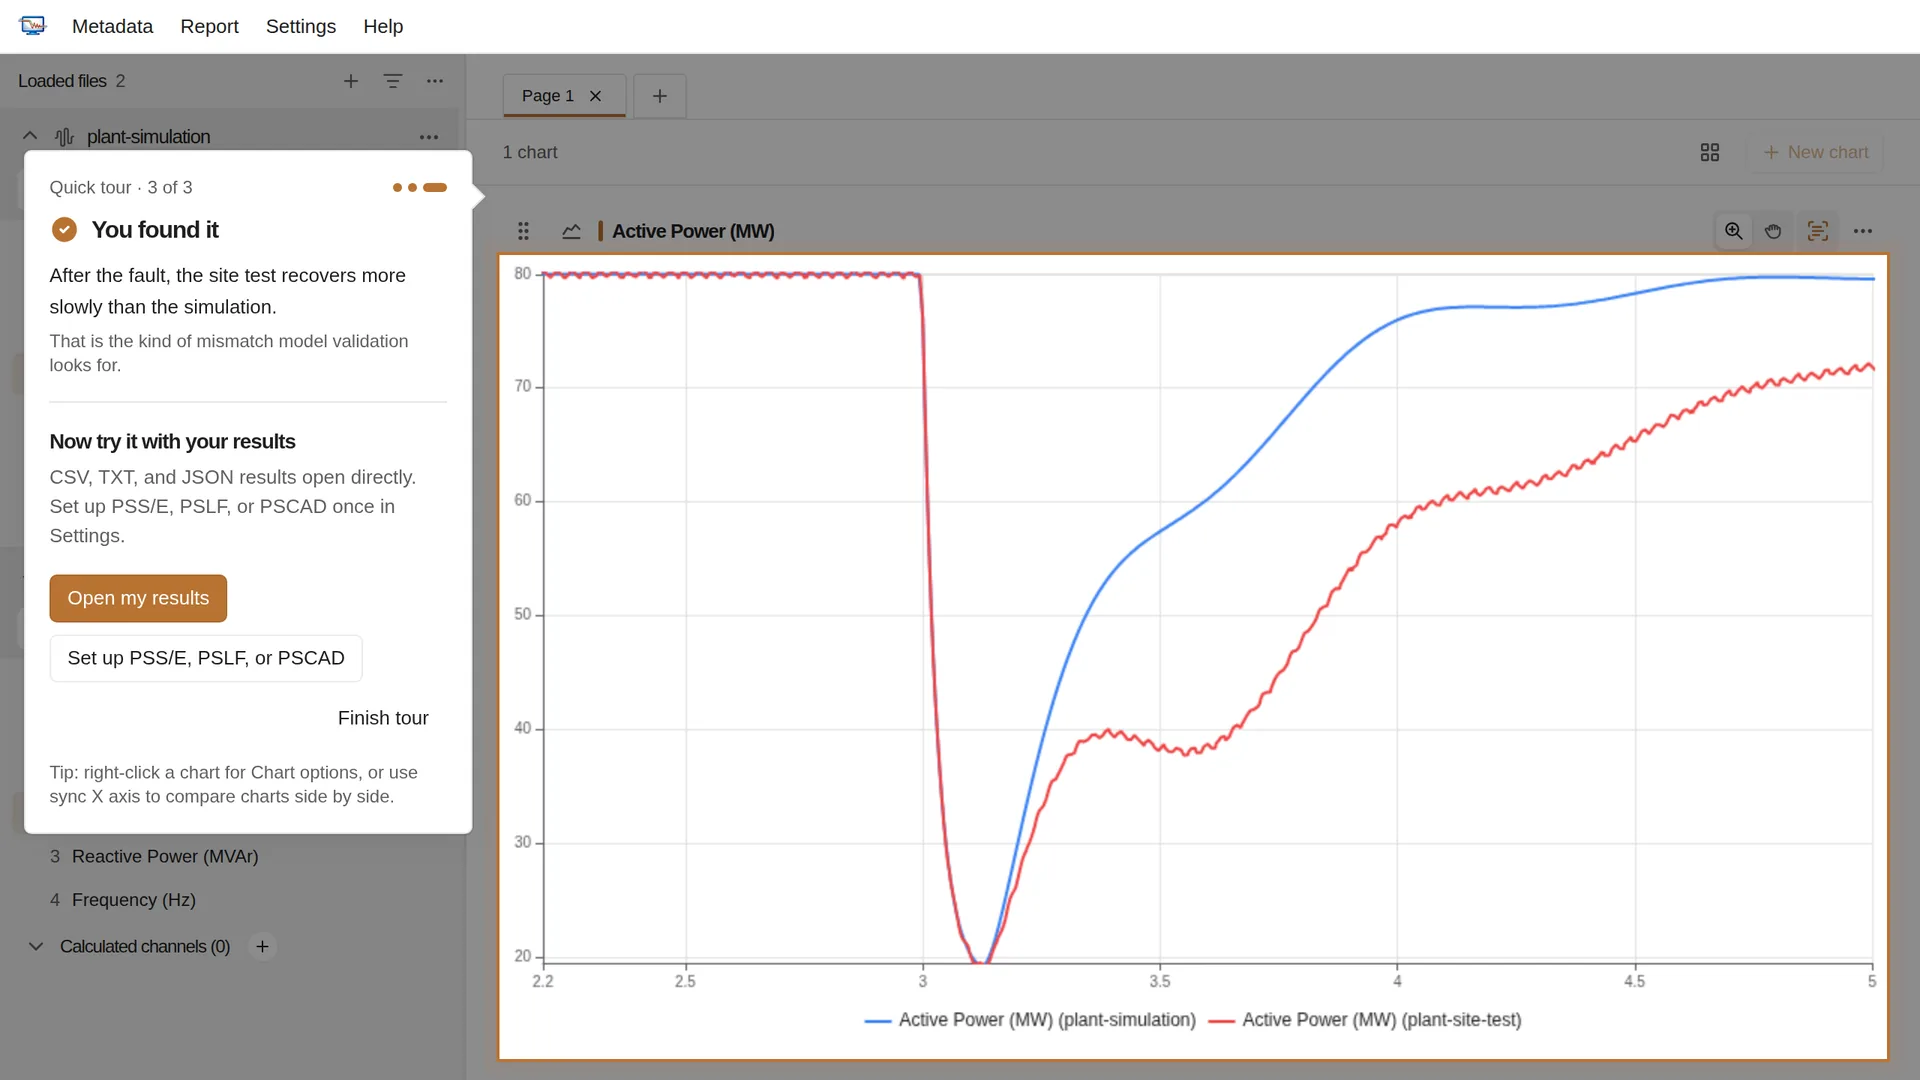
The last step reminds you that CSV, TXT, and JSON results open directly, while PSS/E, PSLF, and PSCAD results need their tool paths set up once in Settings > General. Choose Open my results, Set up PSS/E, PSLF, or PSCAD, or Finish tour. Each choice ends the tour and closes the sample files so your workspace is ready for your own results. Use Skip tour to leave at any earlier step.
Completed and skipped tours stay dismissed across restarts and updates for that local profile. If you close ESPlotter before answering the invitation, it appears again on the next launch, and an unfinished tour offers to continue where you left off. Profiles that were already in use before the tour existed do not see it automatically.
After the tour, when no files are open, the channel sidebar shows how to open results. After you open your own results, a short hint beside the sidebar points to the signals to plot until your first one appears.
2. Get the sample study
Download hilltop-fault_100ms.csv. It is a 10-second transient-stability result: a three-phase fault at the HILLTOP 138 kV bus starts at 1.0 s and is cleared 100 ms later by tripping one circuit of the line between RIVERSIDE and HILLTOP. The file contains bus voltages, angles, frequency, and generator quantities.
3. Plot two bus voltages
- Drag the file from your computer onto the chart area, or click + at the top of the channel sidebar (
Ctrl + O). The file appears in the channel sidebar on the left. - Click VOLT 3104 HILLTOP 138 (pu). ESPlotter adds it to the selected chart.
- Click VOLT 2203 RIVERSIDE 230 (pu) to compare it in the same chart.
- Click the chart title and type a name, for example
Bus voltages after the HILLTOP fault. PressEnter.
You should see both voltages drop at 1.0 s, recover after the fault is cleared, and settle close to their pre-fault values.
4. Export the chart
- Open ⋯ in the chart header and choose Save chart as.
- Choose SVG (vector).
- Save the file and open it.
The export matches what you see: title, visible series, legend, zoom, and axis range. SVG stays sharp at any size; choose PNG (raster) or JPG (raster) for tools that need an image file.
Next steps
| You want to… | Continue with |
|---|---|
| Learn the interface and how a workspace works | Tour the interface |
| Open PSS/E, PSLF, PSCAD, TSAT, or SSAT results | Supported file formats |
| Build a page of charts for a study | Build chart pages |
| Compare two simulation cases | Compare fault-clearing cases |
| Share results as a PDF or Word document | Create a PDF or Word report |
| Drive the open window from Python | Control the app with Live |
| Export charts from Python without the window | Run without the app |
If something does not work, start with Troubleshooting.